Friday, July 31, 2009

Short term sentiment change


To Bearish.

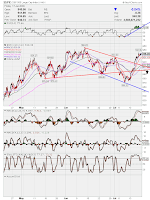
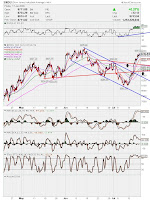
I see a move down next week.
Here are 5 things to chew on.
I almost now wish I shorted the close more aggressively than I did.
(my apologies for all the url links, instead of posting all images. Some are older observations)


1) SPX and VIX both up on Friday: 9 of the past 12, resulted in a down day for the next day.

http://lh6.ggpht.com/_APmrYvpA45s/SnNnkmUw8QI/AAAAAAAAEEs/32rFGtLH_R0/s1600-h/SPXVIXWatch%5B2%5D.png
Courtesy of Cobra's Market View (link on right)


2) Friday's end of the day spike in VIX makes it even more interesting.
(the last time i recall one bigger than Friday's, was 2 Jan 09. Which was a prelude to a large
intermediate move down)

http://lh3.ggpht.com/_APmrYvpA45s/SnNnlKrjmZI/AAAAAAAAEE0/hZxnMwXpQvA/s1600-h/VIX15min%5B2%5D.png (Friday)

http://i204.photobucket.com/albums/bb15/Erik28tx/vix_5min.jpg
(Jan 2nd, 2009)

3) SPX and VIX both up for the week
(although one might "assume" that since on daily basis equates to 75% down probability, this would be automatically "mega-bearish". However, the past 2 times this happened were actually large intermediate direction changing points, Mid Sep 08 and Mid Mar 09 were the past two. This one is arguable, as it has come before a crash as well as before a large rally. Also the last candle stick structure looks almost identical to the March week, there can be a bullish argument for this. For probability sake, I think it's best to say that "for now" we can call this one UNDETERMINED as of yet. So I wont say this points bearish, however since its a very rare occurrence and has happened right at the crash and the rally "start"... I wanted to mention it here.)

http://stockcharts.com/h-sc/ui?s=$VIX&p=W&yr=1&mn=0&dy=0&id=p68264773822&listNum=12&a=174352066

4) USD / SPY decoupling
The dollar was absolutely hammered Friday, yet the market was barely up.
The last time I remember seeing a divergence that strong was 19 March.
(on 20 March, the spy fell over 2%)

http://stockcharts.com/h-sc/ui?s=$NDX&p=W&yr=3&mn=0&dy=0&id=p25925276563&a=172339768&listNum=12&listNum=12

Broad Market Pullback "target": 1525 $NDX (trendline)

http://stockcharts.com/h-sc/ui?s=$NDX&p=D&yr=0&mn=6&dy=0&id=p17589378026&a=171083389&listNum=12

..
Disclosure: Long DZZ (1 swing) & Short MAR, AEM... Long SRS, QID (4 short terms)

Wednesday, July 29, 2009

Just a couple random charts w/ thoughts


Can't really think of anything to post tonight....


added some thoughts/ramblings on the charts.....fwiw

bkx
ndx
dzz
tm

Monday, July 27, 2009

Gold looks like absolute garbage


Excuse the phrasing, but really.... It's just trading that way.

I stand by my call from March: Gold will see 750 before 1000.

I will be the 1st to admit, gold is very VERY difficult to time on the short term basis day to day.

However, with that being said, I am looking to open up a large core IRA Swing Trade position in DZZ here shortly, place a very tight limit stop loss, and just and let it go for a couple weeks to likely months followed with a loose trailing. It's not my favorite vehicle (etn), but for a multi-week swing ira play, it fits the bill here.

Using $GOLD 967.10 as my stop out, and 880 (the 200ma as my price exit/target)

Since March, the $USD has tumbled from 89 to 78.64 here.....that's a very big move down.
During that same time, $GOLD has done....well nothing at all.

Ya know, if gold can not go up at all when the dollar is tanking, what is it going to do when the dollar catches a bid? I dunno, but there are way too many stars aligned here to bet against gold NOT going lower. It has had everything going in its favor, yet its looked stale the entire time here.

Sunday, July 26, 2009

The Nasdaq 100 ($NDX) get's No respect.


Since Sept 2008, the INDU, SPX and RUT are all right on the verge of retracing 50% of the down move from September. The $COMP is at around 57%. While the $NDX is at 61%.

$NDX is the "ONLY" index that made a higher low in March 2009, compared to Nov 2008, the only one.

If you take the Monthly, Weekly, Daily and 60min charts....the $NDX has cleaner patterns and channels on every single time frame than any other index.

Ok, so the charts are very clean, got it. On to my hypothesis, which is this.....

#1: What the difference in the NDX vrs the COMP?
- well the NDX is the Big Cap Tech, the COMP is all tech.
- Big Cap tech is alot more stable, has more cash, ie more market cap, less speculative,
and more household established.

#2: Why has NDX been by leaps and bounds the strongest performing index since this became a bear market?
- Simple, they are the MOST removed from the financial crisis.
- Liars loans, excess leverage, real estate bubble, derivatives, etc etc. that all has a direct
relationship to the banks and brokers, reits, and also since its credit related it has a
stronger impact on the smaller cap type stocks that have loans, and much less cash on
hand. Tech, most specifically large cap tech is the safe haven from all this.

#3: The $NDX has been the safety trade here. It has not been the leader due to potential future growth potential. As if that were the case, the COMP would be neck n neck w/ the NDX, as "growth potential" is more reflected in smaller caps going up in relation to larger caps. The bottom line is with "Large cap Tech" there there is the LEAST amount of chance of a ponzi scheme, a dividend cut, a bail out, even an eps miss with these stocks in the $NDX. They have so much cash on hand, they can most easily cut costs to make numbers.

Another thing, that I think people forget alot of the time is that Large Cap tech has one of the "least" amount of harm from deflation, as compared to other sectors. It "arguably" has almost none. With telecoms actually being the least of all.

http://pragcap.com/performance-and-the-dollar-correlation

And when you look at the sectors and without getting too "economist like" about it, it is pretty simple to understand.

The closer it is to something tangible, that the consumer is buying with his/her US Dollar to live from (eat, build with, produce) that makes it the most inverse to the dollar.

The less tangible, and less related to something local to the the US is then less inverse to our local dollar. (telecoms, tech, etc)

....and I digress.

People are not all piling into GOOG because they think it's going to 1000 (it's not)
People are not all piling into AMZN because they think it's going to expand 5X (it's not)
People are not all piling into INTC because they see it getting more market cap (it's not)

These are rallying so much b/c they are safety trades, based on balance sheets.
When all the prior collapses were from suspect balance sheet stocks, it only makes sense that the leader here on this "P2" is based on balance sheet strength.

However where is the growth? Revenues are declining. One can only cut costs to beat eps for 1-2 qtrs, maybe 3. Eventually all the costs will be cut to the bone, and the only way to beat is via actual top line revenue growth.

...i digress again

Daneric had a very interesting speculation tonight, and I agree with it 100%.
http://danericselliottwaves.blogspot.com/2009/07/citibank-and-banking-laggards.html

-The banks have lagged this entire move here very badly.
-According to the "dow theory" fans out there, for this to be the "end" of a bear market, doesn't the same sector that led us down have to lead us out to the upside? (I really do not understand why so many people are in love w/ the Transportation sector as some kinda of forever leading indicator signal.) It just seems like one of those things that way too many put too much stock into, and therefore it makes it actually worthless. Almost the same as being dead-set on trading the spy only, even when/if the qqqq or dia have a much cleaner set up. It just does not make sense to me, being stubborn and using the same thing over and over again and not adapting or being open to new things can only hurt the bottom line, or at least that is how I am trying to see it here. If everyone is watching the exact same set-up, its not a set up...it's a trap.

-Aside from the charts, I think we need a bearish capitulation to signal the "top" of P2 here. And I do not see that ending with this current sentiment here, there are some signs yes (such as Roubini's more bullish call, etc). That is defiantly a "bear capitulation" sign. But its not there yet. We had Harry Dent on TV just last week "betting" Dennis Kneale 1000 bucks that the dow would be at 3,800 in 2010. (that's not bearish capitulation!!!)

-On to dano's point. For us to reach a euphoric/climactic top here, it's going to have to be done with the financials. (NOT w/ big cap safety play tech!). I don't know what it is going to take to jump start them though. I mean we had Meredith Whitney, we had Roubini. Yet looking at the $BKX chart, one can not even tell that the market has had a 10% 2 week rally. It looks dead. Of course the Brokers have rallied huge. However the $BKX is a bank index (not broker). Moving forward, no one knows "WHEN" it is going to happen, however we all know that eventually the fed lending rate is going to increase to higher than its current ZERO. That will put pressure on the banks. Since the market is forward looking, I can understand why they are not popping here, even with the 100,000,001 upgrades and pumps.

But to achieve bearish capitulation and reach the top here, I don't see it happening any other way than there being "re-assurance" , well actually "false-assurance" that the Banking system is totally good to go. The money flow is still headed as FAR away as possible from anything even close to a "bank". (ie the $NDX!) Which is why, I don't believe we have bear capitulation yet.

So for a longer term change of sentiment/direction, I am looking for 2 specific things:

a) the NDX chart to show a double top w/ neg weekly divergence
(there needs to be a signal, a strong one that this "safe" piggybank is totally full and no longer accepting deposits. When there is no more upside in the NDX, there will be no more upside in any index)

b) a euphoric pop in the financials (mainly banking/$bkx) sentiment.
(this is the only way to break the bears backbone and suck in all the last of the dumb retail into the game)

Saturday, July 25, 2009

My Earnings trade Gameplan: Hedge (Pair-Trade) Ideas of the Week: July 27-31 (MAR, GMCR, GOOG, X, DO, XOM)


I try to trade what the market gives me, as we all do.....

There are times I have "NO CLUE" what the broad market is going to do short term. (like now)
That does not mean there is not money to still be made and trends to play, there still is (imo).

You can (if you choose too) browse through my May-April posts, and most ideas I posted were Weekly Pair/Hedge trades. Why? Because I was not that confident of the overall market direction. Past performance is NOT indicative of future results. (Those went 5 for 7)

I said it before that last qtr the earnings trend was "easy". That might be an overstatement, as no trading is "easy". But last qtr there were so many shorts on board, that once the earnings trend was established early as a very bullish one, the game-plan was pretty simple. ----> find the highest shorted stock, and buy it long 3 days before the ER, then sell it 1 hr before. (since everyone was "blowing out the estimates"...most shorts were covering prior to the report out of fear)

For this qtr, so far that trend has somewhat carried over. However, even though the broad market is very strong, just as last qtr, due to the reactions being more "mixed" this qtr, especially some of the last few and not as "everyone bullish across the board", I do shy away from employing that identical strategy.

This qtr, it seems that many companies are missing the top line (revenue), but beating the bottom line (earnings). The market's reaction is all the truly matters. However that it not really a bullish long term sign there at all. That means the reason they beat the bottom line is from cost cutting, not actual growth.

So after browsing through a few hundred charts and deciding if i was going to trade these earnings, and if it was even worth it here as the market direction seems tricky. I decided that I would, and to employ a pair trade only (hedged) strategy based off the same trend that worked last qtr PLUS the revenue/eps reality of this qtr. IE:

Fundamental Game plan:
Long a momentum stock that is getting ready to report, and ideally has lots of shorts.
...
Short a momentum stock that has already reported and had weak revenue, yet ideally still had an initial knee jerk reaction UP
(exit the pair trade prior to the ER, as no "gaming")
...
Also, I am looking to be putting the options to the side for a bit, and going straight STOCK here.
(larger size plays, as they are hedged 50/50:short/long)

(energy)
Long XOM
Short DO
(exit on Close of Wed, as XOM reports Thurs AM)

XOM reports on Wed, and I can not find a momentum name stock YET that has sold off "before" its ER. Yes some sold off after (amzn, msft, goog). However the earnings "sentiment" is still bullish, and people are buying before reports here. I would "expect" that to weaken somewhat, as per the MSFT and AMZN rude awaking. However not enough to kill the entire market trend.
DO did "beat the eps", however they had a decline in income, and I like the chart set up alot.

(consumer)
Long GMCR
Short MAR
(exit on close of Wed, as GMCR reports Afterhours on WED)

GMCR has 34% shorts as of the last Bi-Monthly data. And with the SBUX "reaction" here fresh in traders heads. (mine included!) I have a pretty good hunch that "SOME" of those 34% might cover before the report. I think GMCR is a train wreck longer term, but its a short term trade, that has a rationale to it here. MAR already reported on the 16th, and cut their fwd forecasts, also with a 76% decline in Q2 profit. (yet they "beat the street eps" lol) I feel the only reason MAR has held up and retraced most of that sell off, has been since that exact same time the broad market has been on complete fire pulling it along "somewhat" with it.

(no relation)
Long X
Short GOOG
(Only for 1 day:Monday, as X reports before the Open on Tue. The GOOG short could be held open longer. But jmo, MAR i "think" is the individual best looking short)

X has 15% shorts on it.
GOOG already reported, virtually no shorts and a triple top at 447, which the $NDX has been pushing higher the entire time and index wise looks the most set up for a short term pullback.

Index Intermediate Levels to Watch. ($NDX is the Leader)


Short term: no clue.

And I am not trying to guess it either. (100% cash for short term trading)

I did purchase a few DUG aug 17 calls @ .90 on Thurs PM, only to sell them all right back Friday AM @ .90. After contemplating and thinking it....XOM reports this coming week, and as the biggest portion of DUG, I seriously doubt they sell off XOM running into the earnings. Even the stocks that have reported bad numbers this season still ran up "into" the earnings. (amzn, msft, etc). So no reason to fight the prior established tape trend here to me.

Short term charts (60 min and almost the daily's are screaming "overbought"), but we have seen how long that can last both up and down.

It still "feels like" to me they are about to pull the rug from underneath this market and leave all the retails holding the bag here. But the tape on Friday sure to me did NOT suggest that is ready to happen yet. I mean all the signs "seemed to be there".
a)msft and amzn had terrible numbers and both sold off.
b)typically Friday after a HUGE up week is normally profit taking
...
However as the day went on, bullish strength was built up later towards the close, which is NOT indicative of end of the week profit taking at all. When volume is anemic thin, it is usually bullish more so than bearish. (as we also saw in late Dec as well)

Which is why to me, short term: NO CLUE

I know most people follow the COMP (more than the NDX), however the NDX is the real leader. Remember that NDX was the ONLY index that made a "higher low" in March.

We still do NOT have neg divergence yet on the weekly charts, that would be something bearish, when it does finally comes, but it actually has not yet.

So here are just some longer term FIB retracement levels to watch.
If they do break the 1st level, (to me, intermediate term), It could be a sign then are headed to the 2nd levels/targets.

Again, I have NO CLUE short term.

Although I do strongly feel that the $NDX is going to be the best signal here and should be watched the closest, as it is by far been the huge leader here for the entire market. (which is why I also included the $NDX monthly chart)

$XII: 480, 495
$SPX: 994, 1014 (as well as the psychological "1000")
$INDU: 9200, 9422
$NDX: 1615, 1629
$RUT: 553, 599
$COMP: 2012, 2063 (as well as the psychological "2000")
$VIX: 22.79, 19.00 (if 22.79: the 200ma weekly does not hold here, it looks like it could very well continue down in it's current wedge until the wedge completely runs out of room, which would be at around 19.00est, which is also the same low from Sept)


Thursday, July 23, 2009

USO and UUP


UUP: double bottom w/ pos divergance
..
USO: lower high (as market makes a higher high) + rsi backtest
....
Short term (1-4 trading days), It looks like Oil/Energy wants to pull back here. Since its been a lagging sector here on this push and was the first to drop on the prior leg down, I "think" that it looks like one of the better risk/reward "falling knifes" to attempt to catch here.
...
DTO, DUG or ERY look good here to me, for a quick mini swing, with a conservative short term exit target based off of:
...
Target: USO 33.00 (the trendline)
Let's see if the ole technicals work here....USO is giving one of my "fav 2 signals"
..

Wednesday, July 22, 2009

Wrong

No clue short term.

Didn't obviously see any kind of SBUX blast-off coming at all. (oh Kudlow is talking about it now.....geez)
.
That just re-enforces to me to not "break" any rules, no matter what I "think", that's what they are rules for.....one of those being "gaming earnings".

There are just too many signals that "feel" like they are about to pull the rug from underneath the market here. Guessing when that happens...who knows, I surely do not.

With the overall earnings trend thus far, it would "almost" seem that a smart trade-plan would be the same one that I kept running into the ground last qtr. (go long the most heavily shorted name 3 days before the ER, then sell it 1 hr before the ER, keep doing that 1-3 stocks a week over and over).
But I feel that its also trap, even going long with those set defined conditions.

When in doubt, stay out.....I myself will be taking a break for a week or 2 and watching the tape move several times before trying to read/trade it.

If the market gaps up or flat tommorow morning....I "think" DUG looks like good 2 day swing buy, very good relative strength today. (then again, im just watching....for now)

Sunday, July 19, 2009

Numbers to watch for the Week.


Going into last week, I was nuetral...and wanted 8350 before looking to go short.
Waiting for a 200pts dow pop..on "MOST" cases is a "usually" pretty safe way to play things, especially on an expiration week. (just as waiting for a 200pts down swing to go long would be).
.........How the market humbles you.
...
Looking ahead to next week......
If the DOW can take out 8877
If the RUT can take out 535
If the SPX can take out 956

If those 3 happen, then I will "change my tune" on my intermediate term setiment and NOT be in "short the pops mode". (in other words, those 2009 highs-are my "mental stops" for the intermediate broad market trend)

As for the short term, I think even the most bullish scewed opinion sees a likely pullback ahead here. The cleanest bullish longer term set up, could be that all indices pull back and find support on TOP of all the old wedges from which they broke out. Which would be

1) the top of the channell
2) the old "neck line support"

In other words, if 1) does not hold......I think that it heads to 2)

Even if every single index heads to 2)....the intermediate UP trend is still in place.
(see charts)

RUT: 510, then 500
COMP: 1850, then 1820
NDX: 1485, then 1470
INDU: 8500, then 8400
SPX: 905 (1 & 2 are one in the same)

If we do get these levels short term, I will then move to nuetral for the short term and then let the market decide what the intermediate trend is. However due to the intermediate signals from:

A) the VIX continuing to make NEW lows, yet the SPX not a NEW highs
B) the Issue:Volume ratio >3

Because of those 2 signals, on the Intermediate term I still do favor the bearish side. However I am just playing it short term bearish to those index number pullback targets, then I will wait and see what the market wants to do.

When there are Intermediate signals that say SELL, and let's say Short term signals that are mixed, I lean to the SELL side. (especially if we just had a huge move up short term)

I am sure there are many EWT traders who are labeling last weeks' move a "wave 1", as it was the first "impulsive move up" in quite a long time. Hence in theory that would be followed by a wave 2 pull back, then a wave 3 ROCKET RIDE upwards. I am not an EWT trader, so I have no clue in that regard. But with combination of news and charts, its hard to imagine a stronger up-move than that as we get into the 2nd and 3rd tier companies earnings reports...just my 2 cents.

As far as Sentiment wise, I just don't see the "probability" of another week of
-GS blow out
-INTC great numbers
-Perfectly timed M.Whitney pump
-Very well spun Roubini twist/pump
....all together launching all like a firecracker trigger, set-off to explode in sequence just after TOO may people jumped into the "head and shoulders" breakdown "set up".
..
The shorter term time frame charts do "appear" as if last week was "the real deal", and that the next pull back we get is a definite BUY. But to me, there are WAY to many of the longer term indicators saying otherwise. From my experience, the longer the time frame charts and indicators should always be given more clout.
..
Lots and lots of variables and smoke out there....if/when it total doubt the best trade at times is no trade.

Thursday, July 16, 2009

The Giant appears to have been stunned.

GOOG------------->


(thank goodness I can still pick individual stocks pretty well, b/c the spx has admittedly baffled the *&^%ing *&*@ out of me since after the gap up Wed)

Top em up......Chop em down.................

http://erikmarketview.blogspot.com/2009/05/lvs-appears-to-have-topped-out.html (11.84)

http://erikmarketview.blogspot.com/2009/06/goog-has-very-possibly-topped-out-at.html (447.00)

http://erikmarketview.blogspot.com/2009/07/sbux-looks-like-it-might-of-topped-out.html 15.54....?

SBUX: You are next, see ya on Tue buddy.
(I got my mocha-java latte ready for ya......)


Wednesday, July 15, 2009

SBUX looks like it might of Topped out.


Short, Intermediate....and perhaps Long Term....it possibly has.
.
Weekly and 60min charts to the upper right.

Gaming earnings is never the "best trade", as I re-iterate that now and again. Very very rarely will I speculate of an earnings reaction. I much prefer to watch the reaction, THEN jump on board and forgo the initial portion of the move to in turn obtain the ability to watch it's hand tip first. Sometimes even that is difficult too. Ex: something just did not "feel right" yesterday to me with GS, even tho I wanted to short at 150, and had planned to if it could not get over it... I think it was b/c i felt EVERYONE in the world was watching that ezact same set up right there. Plus they way they closed it at 150.00 right on the button, just seemed "strange", felt like a trap. It just didn't feel right, so I didn't enter it. I'm now in hingsight glad I had that feeling, b/c I had strongly contemplated entering heavily short at 149.50.

I don't normally like to trade earnings, and the only earnings report that I have ever given an opinion on w/ rationale on this blog was TM back last qtr. http://erikmarketview.blogspot.com/2009/05/toyota-motors-early-entry-to-one-of.html

I do have a strong opinion SBUX is going to have a terrible report. I feel they have a terribly flawed business model.
.
(***I am short SBUX for disclosure and will remain short for at least 1 week, possibly for 2-3 weeks***)
.
Also MCD, GMCR and THI...are there to gobble up it's market cap and all 3 of those have a better business model to me.

Estimate EPS for Tuesday is .19. They have not earned that much since the 1st qtr 2008.
Why is it that high?....sure there are many factors beyond what the eye can see, so that's not something worth over-analyzing or breaking down. However the "momentum" of the broad market is one of the factors. Remember, when the market goes up=Analysts raise the bar. When the market goes down=Analysts lower the bar. Analysts are chasers and pumpers. (that does not mean they are always wrong or always right...they are just almost always kinda late to the party)

GS can make money in any market. INTC has tons of foreign exposure and they even said that China was the best part of its earnings. Yea SBUX has a couple franchises overseas, but its backbone is almost entirely the U.S. consumer. (which I feel is a very bad thing here, and if people think that everyone is going to report like GS and INTC, they they are out to lunch)
I think that intermediate term (over the next few weeks) that the more likely scenario is that many stocks are getting set up for a fall, as we get into the 2nd and 3rd tier company's....I don't see the likely hood of a majority of "intc/gs" type blowouts.
..
I could be dead wrong, I could be...and that broad market hunch is NOT one that I will "fall in love with".
..
I have always been a far better individual stock trader, than a broad market trader. As far as the broad market, I think that once we get 1-2 more weeks worth of earnings and can disect what differant sectors have done before and after and we can start to notice some trends, whatever they may be, then look to front-run trade them.
..
Again, last qtr's stradegy of simply find the most heavily shorted stock, and buy it 3 days before ER, then sell it 1 hr before...I doubt that will work as well this time. That only worked so well last qtr, b/c the vast majority of stocks were "reporting well"...so there was a broad market fear drivin into the shorts, no matter who the company was.

This is just my opinion, and yea it's a strong one.
I think Starbucks is dead money, and that without a timeline:
My call is that it sees 9 before 15.50, possibly sometime in August.

Wed, July 15th

I did NOT forsee todays afternoon action coming AT ALL.
I had felt that the gap up today was a nice SHORT entry, and I did add to my sbux short today midday, and do still hold it....only position.
(stoped of tin and mar at the open)

VIX was up today along w/ the SPX.
8 of the past 9 times we have had that, the next day was down, fwiw.
I remain bearish short term.
If the $COMP and/or $NDX make new 2009 highs, then I will re-evaluate.
(as they are both close to a new high or a double top, we shall see)

Tuesday, July 14, 2009

The VIX to SPX divergance: Bearish, plain and simple.


Here is a prior post of mine (link above) just talking about my opinions on the vix, and it's use as a longer term market tool. (fyi: the vix moved to 35 on that move, not 36....so I overshot the target by 1)

Ok, so big deal... when the market tops the vix bottoms, what good is that? It's not any good
Is it "EASIER" to spot a vix bottom than it is a market top? Nope.

So Why it is important:
Since 956, one would expect since the market is now lower....so obviously the vix must be higher right? WRONG (vix had it's lowest daily close today since Sept 2008!)

This is bearish for the market, and I am sure some super bull would of course argue that the lower vix is bullish, but I would ask them to show me a chart where the vix served as a leading indicator. (its NOT a leading indicator). But more importantly, ok....so if a LOWER vix is bullish, then why are we now NOT above 956 spx? I mean the vix is lower now, so if its "bullish", why are we only at 905? I rest my case.

So the 64,000 question would be "Has the vix bottomed"? I haven't a clue. No one has a clue.
Again there is NO difference is trying to spot an spx top OR a vix bottom, those are BOTH total fools games, and they award no "bonus" points or money in your account.

All that I am reading and interpreting from this divergence is just what it is and nothing more.
It is a piece of the larger puzzle.

The VIX is moving down more, even though though the spx has not moved up.
So back to why this is bearish. Pull up at 20 year chart on the vix.
The vix does NOT go under 10. It just doesn't, there is a blip of 9.37 in 2007, which was about it. Is this VIX going to 10 here? I doubt it, it just illustrates that its actually NOT a totally unknown variable, as we know there is a floor to it.

Mathematically...the spx might go to 30,000. (trying to make a point, bear w/ me. There is nothing saying that it cant, this is a total unknown variable)

We do know, that the vix can NOT go below ZERO.
And it basically never goes below 10, from its history, even in raging bull markets.
(So this has a limit to it, making it differant)

In conclusion, the observation is such:
The "Fear" is departing, yet the market is NOT moving up "lock in step" with it.

Well if the market is not really going up (as much compared relativly) when the fear is departing, then what is going to happen to the market then when the fear returns?

Monday, July 13, 2009

Intermediate/July Target: 846 SPX - Booyah!


I know almost everyone is watching the Head and Shoulders breakdown, (even Jim Cramer ? lol) and most following that have an even lower target. Even though I believe alot in the chart pattern set up, I do not as much with the target "must be met".

Why 846? Because that is the 38% retirement of the entire move up, so even from a "bullish" argument, that also could be an expected and accepted "pullback". So to me that makes it actually to me fairly cconservative target as well. So if this "perhaps is" a pullback before a end of year rally higher. (which I do NOT think it is) then 846 can still be a likely destination in that scenario as well, so in my opinion it's my end of July target.
..
Just for a list, with out targets or specifics, some stocks that I follow and look to enter short periodically here for the intermediate term FWIW:
...
MAR, TIN, SBUX, GOOG, GRMN,
ISIL, GMCR, AEM, WFMI, MA,
BLK, DO, SPG, MS, GS, BCSI, BIDU
....
(I prefer NOT to short anything within 1 week before earnings, and nothing over earnings)
....
Jimbo Cramer, I am going to replay your reaction at 846 later this month, because I want to compare them. Because (from my experience), when you get REALLY CARRIED AWAY an over-animate, it is more likely a good time to short the market. A few years ago (when I didn't know any better) I remember watching your show and you said something that I actually thought was a pretty good mentality. Something to extent of "when there are more bulls than bears we go up. When there are all bulls and no bears, we stop going up. So you are calling the top Freudian slip, thanks. I knew that you inside probably do have a decent idea where things are going.


Meredith Whitney rocks the House!

Looks pretty much close enough for me, so thank you Meredith Whitney
(Close as in those ...... Index Numbers to Watch, that I posted this weekend)

http://erikmarketview.blogspot.com/2009/07/index-numbers-to-watch-for-next-week.html

I think SHORT term, that this right here looks pretty decent spot to "dip" into some shorts
We could go a tiny bit higher perhaps, so maybe I am a little bit early, but I do like the entry.
I just don't feel in my gut its one to go totally BONKERS with though.

I am looking for around 890spx Index wise to exit my short plays this week
(very conservative play, nothing big here)

And I am only playing these 3 till the end of this week, b/c I know they are not reporting till at earliest next week.

(I started to scale into shorts right at the close, SBUX: 1.97, 1.971, MAR: 1.9, TIN: 1.95, 1.96)

Those are my stockcharts charts numbers of them.
http://stockcharts.com/def/servlet/Favorites.CServlet?obj=ID3381442 (link)

(fwiw....I will mention what I "think" are some great stocks to look to short, cover and re-short over and over again for the summer time on the next post, those are 3 of them) For now I have to go. (super busy, I missed the whole Meredith Whitney trade, as I was not around for the AM, it sure looked like an FAS delight for the day.

I had twittered (is that a word?) that I had a very strong hunch that she would send the financials higher I would buy in front of her for the day. Oh well...I'll take the next likely direction. which is back down I think. But again, this is not one I feel like going hard and heavy with, but I do like the 3 plays I have here short for the next couple days.

For the SHORT TERM outlook, watch the SPX index. I "think" it holds the key here actually. If you re-look at those 60 mins charts I posted this weekend of the Index numbers to watch, EVERY index actually closed below the backtest line.
(except.......the $SPX and the $XII, they actually closed right back ABOVE IT).

If the SPX leads tomorrow and is the STRONGEST index, technically that "might" suggest we digest this move today and do not go lower immediately. However, the spx has to hold onto 900 and NOT dip under for that rationale to be valid, so it has practically no room to breath at all. But giving today's move the benefit of the doubt, that is the one outlier index that actually got back INTO it's old channel, by 1pt. So if the spx is lets say up a little bit, and the others are down tomorrow, I would interpret that as LESS of a bearish signal. But I am also I think stretching here, as I am trying to give the bulls the benefit of the doubt on purpose to try and be safe about trading to the short side, that's all.

Just something to consider, but even today the spx max pain fell from 91 to 90. (why?) B/C the rally induced chasers (ie call buyers) and once more people buy more calls, THOSE are also calls that the writers do not want to PAY out. (ie that lowers max pain). GS still could not break 150? come on Meridith? I dunno. But short term I do like this overall as a SHORT entry, as I am net short here since the close. Sorry, but I don't have time to post all my charts on here, but the 60 min index charts that I talked about this weekend and those numbers.

Those index charts are 0.2.0 to 0.2.6 (on my stockcharts list)

Just go to the upper right and click on Chartbook, which makes them much easier/faster to search)

*Rambling thoughts, for 2 "conditional" things I am watching*
-If tomorrow 20 minutes before the close, GS does NOT look like it's going to close over 150..I will likely be buying some AUG puts on it

-If on FRIDAY goog has a neutral or slightly negative initial reaction to it's earnings, I will be buying quite a few of the AUG slightly OTM puts on it. I just do NOT want to "game the ER", nor do I want to buy any options before it, as they are being overpriced here with the I.V, as all the straddle buying manaics are driving them up too expensive before the ER. However since Friday is options expo, if the reaction to GOOG does happen to be negative, then I do have a strong hunch that they will do their best to "hold it up and cushion it"...as its expiration day. (remember RIMM the AH reversal prop last month?) The beneficial thing then is for an option buyer is that since the ER is now over, the IV should shrivel up alot, especially if the reaction is a minimal one. So I would love to see goog trade in a very tight controlled range on Friday. Remember, goog does have a strong history of doing that on expiration day too. So that particular set up, would be a good one to me, if of course it even comes like that.

Sunday, July 12, 2009

Another one for the Toolbox


Idea Sparked and derived from something somewhat similar, that Cobra uses.
(listed on my blog roll: http://cobrasmarketview.blogspot.com/ )

http://lh3.ggpht.com/_APmrYvpA45s/Sllr2YpgRQI/AAAAAAAADzs/9Hc6jXdlgyw/s1600-h/NYADVandNYUPVDivergenceWatchI%5B2%5D.png

This to me if for the INTERMEDIATE outlook

This does NOT change my short term outlook, which remains: http://erikmarketview.blogspot.com/2009/07/index-numbers-to-watch-for-next-week.html