


To Bearish.
I see a move down next week.
I see a move down next week.
Here are 5 things to chew on.
I almost now wish I shorted the close more aggressively than I did.
(my apologies for all the url links, instead of posting all images. Some are older observations)
1) SPX and VIX both up on Friday: 9 of the past 12, resulted in a down day for the next day.
1) SPX and VIX both up on Friday: 9 of the past 12, resulted in a down day for the next day.
https://blogger.googleusercontent.com/img/b/R29vZ2xl/AVvXsEjA_Y1ArNm0N9q97xoGjjbTEq6DGJrFiEosRRgDAwqwoZR4tPd3ismGSXNqfiqGN2Me3IaGiQOQsJNOTbxCkxdl0uEC5IBf6Kbh3l8Wxz5rHiKWyGkOfZuAtviKXZQ2FZFfTFkt3dnNr7l9/s1600-h/SPXVIXWatch%5B2%5D.png
Courtesy of Cobra's Market View (link on right)
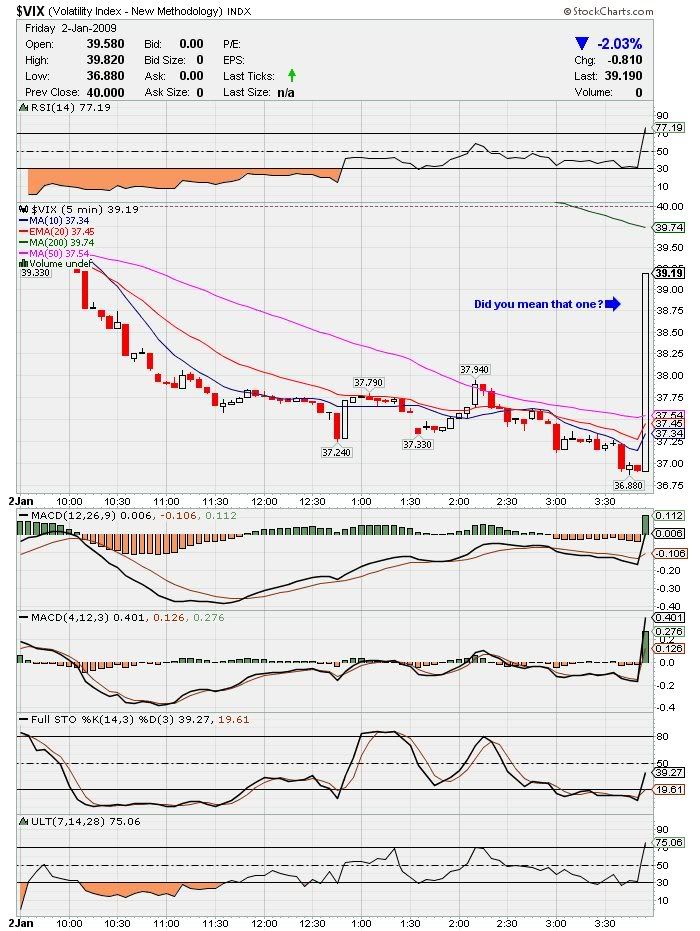
2) Friday's end of the day spike in VIX makes it even more interesting.
(the last time i recall one bigger than Friday's, was 2 Jan 09. Which was a prelude to a large
intermediate move down)
https://blogger.googleusercontent.com/img/b/R29vZ2xl/AVvXsEgtmYALtcP2lwUiOLpXJYmyBanbEFfaE5fo8y1_O1YZKfYEnRm_eY0TMBdRPSXH7j5PUHv-MDn975KLMTk4Vb6hvaHX2esNjhi8dd8kL5UcMh0R1cmBFdJcA7CMs8fBDFMdWzduuaRU2uYr/s1600-h/VIX15min%5B2%5D.png (Friday)
http://i204.photobucket.com/albums/bb15/Erik28tx/vix_5min.jpg
(Jan 2nd, 2009)
3) SPX and VIX both up for the week
(although one might "assume" that since on daily basis equates to 75% down probability, this would be automatically "mega-bearish". However, the past 2 times this happened were actually large intermediate direction changing points, Mid Sep 08 and Mid Mar 09 were the past two. This one is arguable, as it has come before a crash as well as before a large rally. Also the last candle stick structure looks almost identical to the March week, there can be a bullish argument for this. For probability sake, I think it's best to say that "for now" we can call this one UNDETERMINED as of yet. So I wont say this points bearish, however since its a very rare occurrence and has happened right at the crash and the rally "start"... I wanted to mention it here.)
http://stockcharts.com/h-sc/ui?s=$VIX&p=W&yr=1&mn=0&dy=0&id=p68264773822&listNum=12&a=174352066
4) USD / SPY decoupling
The dollar was absolutely hammered Friday, yet the market was barely up.
The last time I remember seeing a divergence that strong was 19 March.
(on 20 March, the spy fell over 2%)
https://blogger.googleusercontent.com/img/b/R29vZ2xl/AVvXsEj9DyiRTwyAMom8VoZUwGJrxXU9NXWCasdqq9ExkPqzCN-65GMZoA6F_xRG5iYXc1JWJZRba64gsqQXOq6qY4alXPEQ3_0s6b2qIHDjlkc2cINrXpFZ4CARvb3fBmyCIW2Ngebvv1JoabA/s1600-h/UUP.jpg
5) Weekly dogi at key long term resistance on the Leading index ($NDX)
http://stockcharts.com/h-sc/ui?s=$NDX&p=W&yr=3&mn=0&dy=0&id=p25925276563&a=172339768&listNum=12&listNum=12
Broad Market Pullback "target": 1525 $NDX (trendline)
http://stockcharts.com/h-sc/ui?s=$NDX&p=D&yr=0&mn=6&dy=0&id=p17589378026&a=171083389&listNum=12
..
Disclosure: Long DZZ (1 swing) & Short MAR, AEM... Long SRS, QID (4 short terms)


