Friday, July 31, 2009

Short term sentiment change


To Bearish.

I see a move down next week.
Here are 5 things to chew on.
I almost now wish I shorted the close more aggressively than I did.
(my apologies for all the url links, instead of posting all images. Some are older observations)


1) SPX and VIX both up on Friday: 9 of the past 12, resulted in a down day for the next day.

https://blogger.googleusercontent.com/img/b/R29vZ2xl/AVvXsEjA_Y1ArNm0N9q97xoGjjbTEq6DGJrFiEosRRgDAwqwoZR4tPd3ismGSXNqfiqGN2Me3IaGiQOQsJNOTbxCkxdl0uEC5IBf6Kbh3l8Wxz5rHiKWyGkOfZuAtviKXZQ2FZFfTFkt3dnNr7l9/s1600-h/SPXVIXWatch%5B2%5D.png
Courtesy of Cobra's Market View (link on right)


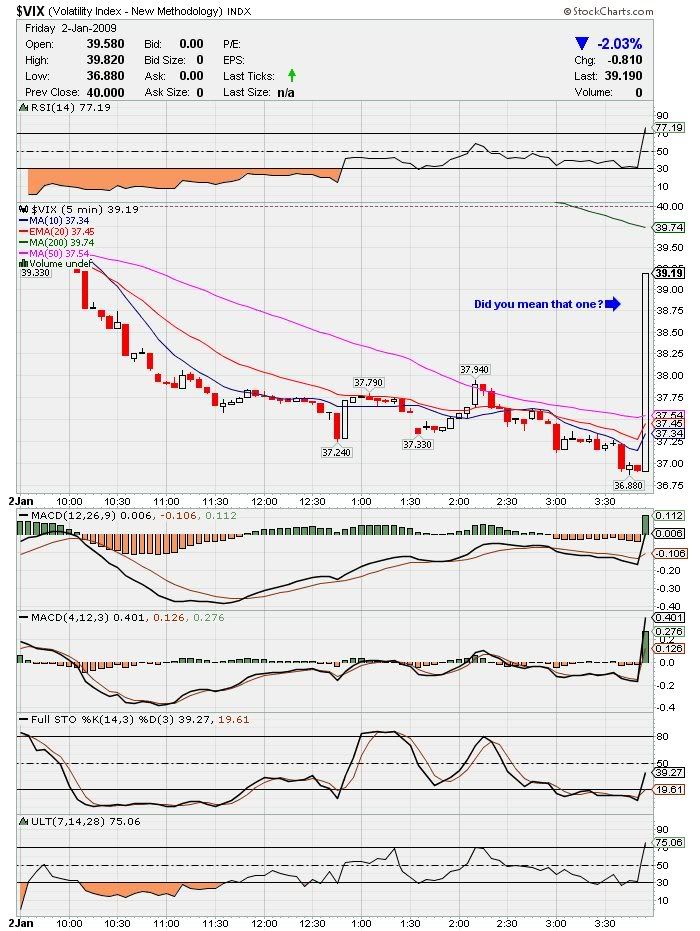
2) Friday's end of the day spike in VIX makes it even more interesting.
(the last time i recall one bigger than Friday's, was 2 Jan 09. Which was a prelude to a large
intermediate move down)

https://blogger.googleusercontent.com/img/b/R29vZ2xl/AVvXsEgtmYALtcP2lwUiOLpXJYmyBanbEFfaE5fo8y1_O1YZKfYEnRm_eY0TMBdRPSXH7j5PUHv-MDn975KLMTk4Vb6hvaHX2esNjhi8dd8kL5UcMh0R1cmBFdJcA7CMs8fBDFMdWzduuaRU2uYr/s1600-h/VIX15min%5B2%5D.png (Friday)

http://i204.photobucket.com/albums/bb15/Erik28tx/vix_5min.jpg
(Jan 2nd, 2009)

3) SPX and VIX both up for the week
(although one might "assume" that since on daily basis equates to 75% down probability, this would be automatically "mega-bearish". However, the past 2 times this happened were actually large intermediate direction changing points, Mid Sep 08 and Mid Mar 09 were the past two. This one is arguable, as it has come before a crash as well as before a large rally. Also the last candle stick structure looks almost identical to the March week, there can be a bullish argument for this. For probability sake, I think it's best to say that "for now" we can call this one UNDETERMINED as of yet. So I wont say this points bearish, however since its a very rare occurrence and has happened right at the crash and the rally "start"... I wanted to mention it here.)

http://stockcharts.com/h-sc/ui?s=$VIX&p=W&yr=1&mn=0&dy=0&id=p68264773822&listNum=12&a=174352066

4) USD / SPY decoupling
The dollar was absolutely hammered Friday, yet the market was barely up.
The last time I remember seeing a divergence that strong was 19 March.
(on 20 March, the spy fell over 2%)

http://stockcharts.com/h-sc/ui?s=$NDX&p=W&yr=3&mn=0&dy=0&id=p25925276563&a=172339768&listNum=12&listNum=12

Broad Market Pullback "target": 1525 $NDX (trendline)

http://stockcharts.com/h-sc/ui?s=$NDX&p=D&yr=0&mn=6&dy=0&id=p17589378026&a=171083389&listNum=12

..
Disclosure: Long DZZ (1 swing) & Short MAR, AEM... Long SRS, QID (4 short terms)

Wednesday, July 29, 2009

Just a couple random charts w/ thoughts


Can't really think of anything to post tonight....


added some thoughts/ramblings on the charts.....fwiw

bkx
ndx
dzz
tm

Monday, July 27, 2009

Gold looks like absolute garbage


Excuse the phrasing, but really.... It's just trading that way.

I stand by my call from March: Gold will see 750 before 1000.

I will be the 1st to admit, gold is very VERY difficult to time on the short term basis day to day.

However, with that being said, I am looking to open up a large core IRA Swing Trade position in DZZ here shortly, place a very tight limit stop loss, and just and let it go for a couple weeks to likely months followed with a loose trailing. It's not my favorite vehicle (etn), but for a multi-week swing ira play, it fits the bill here.

Using $GOLD 967.10 as my stop out, and 880 (the 200ma as my price exit/target)

Since March, the $USD has tumbled from 89 to 78.64 here.....that's a very big move down.
During that same time, $GOLD has done....well nothing at all.

Ya know, if gold can not go up at all when the dollar is tanking, what is it going to do when the dollar catches a bid? I dunno, but there are way too many stars aligned here to bet against gold NOT going lower. It has had everything going in its favor, yet its looked stale the entire time here.

Sunday, July 26, 2009

The Nasdaq 100 ($NDX) get's No respect.


Since Sept 2008, the INDU, SPX and RUT are all right on the verge of retracing 50% of the down move from September. The $COMP is at around 57%. While the $NDX is at 61%.

$NDX is the "ONLY" index that made a higher low in March 2009, compared to Nov 2008, the only one.

If you take the Monthly, Weekly, Daily and 60min charts....the $NDX has cleaner patterns and channels on every single time frame than any other index.

Ok, so the charts are very clean, got it. On to my hypothesis, which is this.....

#1: What the difference in the NDX vrs the COMP?
- well the NDX is the Big Cap Tech, the COMP is all tech.
- Big Cap tech is alot more stable, has more cash, ie more market cap, less speculative,
and more household established.

#2: Why has NDX been by leaps and bounds the strongest performing index since this became a bear market?
- Simple, they are the MOST removed from the financial crisis.
- Liars loans, excess leverage, real estate bubble, derivatives, etc etc. that all has a direct
relationship to the banks and brokers, reits, and also since its credit related it has a
stronger impact on the smaller cap type stocks that have loans, and much less cash on
hand. Tech, most specifically large cap tech is the safe haven from all this.

#3: The $NDX has been the safety trade here. It has not been the leader due to potential future growth potential. As if that were the case, the COMP would be neck n neck w/ the NDX, as "growth potential" is more reflected in smaller caps going up in relation to larger caps. The bottom line is with "Large cap Tech" there there is the LEAST amount of chance of a ponzi scheme, a dividend cut, a bail out, even an eps miss with these stocks in the $NDX. They have so much cash on hand, they can most easily cut costs to make numbers.

Another thing, that I think people forget alot of the time is that Large Cap tech has one of the "least" amount of harm from deflation, as compared to other sectors. It "arguably" has almost none. With telecoms actually being the least of all.

http://pragcap.com/performance-and-the-dollar-correlation

And when you look at the sectors and without getting too "economist like" about it, it is pretty simple to understand.

The closer it is to something tangible, that the consumer is buying with his/her US Dollar to live from (eat, build with, produce) that makes it the most inverse to the dollar.

The less tangible, and less related to something local to the the US is then less inverse to our local dollar. (telecoms, tech, etc)

....and I digress.

People are not all piling into GOOG because they think it's going to 1000 (it's not)
People are not all piling into AMZN because they think it's going to expand 5X (it's not)
People are not all piling into INTC because they see it getting more market cap (it's not)

These are rallying so much b/c they are safety trades, based on balance sheets.
When all the prior collapses were from suspect balance sheet stocks, it only makes sense that the leader here on this "P2" is based on balance sheet strength.

However where is the growth? Revenues are declining. One can only cut costs to beat eps for 1-2 qtrs, maybe 3. Eventually all the costs will be cut to the bone, and the only way to beat is via actual top line revenue growth.

...i digress again

Daneric had a very interesting speculation tonight, and I agree with it 100%.
http://danericselliottwaves.blogspot.com/2009/07/citibank-and-banking-laggards.html

-The banks have lagged this entire move here very badly.
-According to the "dow theory" fans out there, for this to be the "end" of a bear market, doesn't the same sector that led us down have to lead us out to the upside? (I really do not understand why so many people are in love w/ the Transportation sector as some kinda of forever leading indicator signal.) It just seems like one of those things that way too many put too much stock into, and therefore it makes it actually worthless. Almost the same as being dead-set on trading the spy only, even when/if the qqqq or dia have a much cleaner set up. It just does not make sense to me, being stubborn and using the same thing over and over again and not adapting or being open to new things can only hurt the bottom line, or at least that is how I am trying to see it here. If everyone is watching the exact same set-up, its not a set up...it's a trap.

-Aside from the charts, I think we need a bearish capitulation to signal the "top" of P2 here. And I do not see that ending with this current sentiment here, there are some signs yes (such as Roubini's more bullish call, etc). That is defiantly a "bear capitulation" sign. But its not there yet. We had Harry Dent on TV just last week "betting" Dennis Kneale 1000 bucks that the dow would be at 3,800 in 2010. (that's not bearish capitulation!!!)

-On to dano's point. For us to reach a euphoric/climactic top here, it's going to have to be done with the financials. (NOT w/ big cap safety play tech!). I don't know what it is going to take to jump start them though. I mean we had Meredith Whitney, we had Roubini. Yet looking at the $BKX chart, one can not even tell that the market has had a 10% 2 week rally. It looks dead. Of course the Brokers have rallied huge. However the $BKX is a bank index (not broker). Moving forward, no one knows "WHEN" it is going to happen, however we all know that eventually the fed lending rate is going to increase to higher than its current ZERO. That will put pressure on the banks. Since the market is forward looking, I can understand why they are not popping here, even with the 100,000,001 upgrades and pumps.

But to achieve bearish capitulation and reach the top here, I don't see it happening any other way than there being "re-assurance" , well actually "false-assurance" that the Banking system is totally good to go. The money flow is still headed as FAR away as possible from anything even close to a "bank". (ie the $NDX!) Which is why, I don't believe we have bear capitulation yet.

So for a longer term change of sentiment/direction, I am looking for 2 specific things:

a) the NDX chart to show a double top w/ neg weekly divergence
(there needs to be a signal, a strong one that this "safe" piggybank is totally full and no longer accepting deposits. When there is no more upside in the NDX, there will be no more upside in any index)

b) a euphoric pop in the financials (mainly banking/$bkx) sentiment.
(this is the only way to break the bears backbone and suck in all the last of the dumb retail into the game)

Saturday, July 25, 2009

My Earnings trade Gameplan: Hedge (Pair-Trade) Ideas of the Week: July 27-31 (MAR, GMCR, GOOG, X, DO, XOM)


I try to trade what the market gives me, as we all do.....

There are times I have "NO CLUE" what the broad market is going to do short term. (like now)
That does not mean there is not money to still be made and trends to play, there still is (imo).

You can (if you choose too) browse through my May-April posts, and most ideas I posted were Weekly Pair/Hedge trades. Why? Because I was not that confident of the overall market direction. Past performance is NOT indicative of future results. (Those went 5 for 7)

I said it before that last qtr the earnings trend was "easy". That might be an overstatement, as no trading is "easy". But last qtr there were so many shorts on board, that once the earnings trend was established early as a very bullish one, the game-plan was pretty simple. ----> find the highest shorted stock, and buy it long 3 days before the ER, then sell it 1 hr before. (since everyone was "blowing out the estimates"...most shorts were covering prior to the report out of fear)

For this qtr, so far that trend has somewhat carried over. However, even though the broad market is very strong, just as last qtr, due to the reactions being more "mixed" this qtr, especially some of the last few and not as "everyone bullish across the board", I do shy away from employing that identical strategy.

This qtr, it seems that many companies are missing the top line (revenue), but beating the bottom line (earnings). The market's reaction is all the truly matters. However that it not really a bullish long term sign there at all. That means the reason they beat the bottom line is from cost cutting, not actual growth.

So after browsing through a few hundred charts and deciding if i was going to trade these earnings, and if it was even worth it here as the market direction seems tricky. I decided that I would, and to employ a pair trade only (hedged) strategy based off the same trend that worked last qtr PLUS the revenue/eps reality of this qtr. IE:

Fundamental Game plan:
Long a momentum stock that is getting ready to report, and ideally has lots of shorts.
...
Short a momentum stock that has already reported and had weak revenue, yet ideally still had an initial knee jerk reaction UP
(exit the pair trade prior to the ER, as no "gaming")
...
Also, I am looking to be putting the options to the side for a bit, and going straight STOCK here.
(larger size plays, as they are hedged 50/50:short/long)

(energy)
Long XOM
Short DO
(exit on Close of Wed, as XOM reports Thurs AM)

XOM reports on Wed, and I can not find a momentum name stock YET that has sold off "before" its ER. Yes some sold off after (amzn, msft, goog). However the earnings "sentiment" is still bullish, and people are buying before reports here. I would "expect" that to weaken somewhat, as per the MSFT and AMZN rude awaking. However not enough to kill the entire market trend.
DO did "beat the eps", however they had a decline in income, and I like the chart set up alot.

(consumer)
Long GMCR
Short MAR
(exit on close of Wed, as GMCR reports Afterhours on WED)

GMCR has 34% shorts as of the last Bi-Monthly data. And with the SBUX "reaction" here fresh in traders heads. (mine included!) I have a pretty good hunch that "SOME" of those 34% might cover before the report. I think GMCR is a train wreck longer term, but its a short term trade, that has a rationale to it here. MAR already reported on the 16th, and cut their fwd forecasts, also with a 76% decline in Q2 profit. (yet they "beat the street eps" lol) I feel the only reason MAR has held up and retraced most of that sell off, has been since that exact same time the broad market has been on complete fire pulling it along "somewhat" with it.

(no relation)
Long X
Short GOOG
(Only for 1 day:Monday, as X reports before the Open on Tue. The GOOG short could be held open longer. But jmo, MAR i "think" is the individual best looking short)

X has 15% shorts on it.
GOOG already reported, virtually no shorts and a triple top at 447, which the $NDX has been pushing higher the entire time and index wise looks the most set up for a short term pullback.